Release the kraken(2)!
Written on September 23rd , 2020 by RRBIII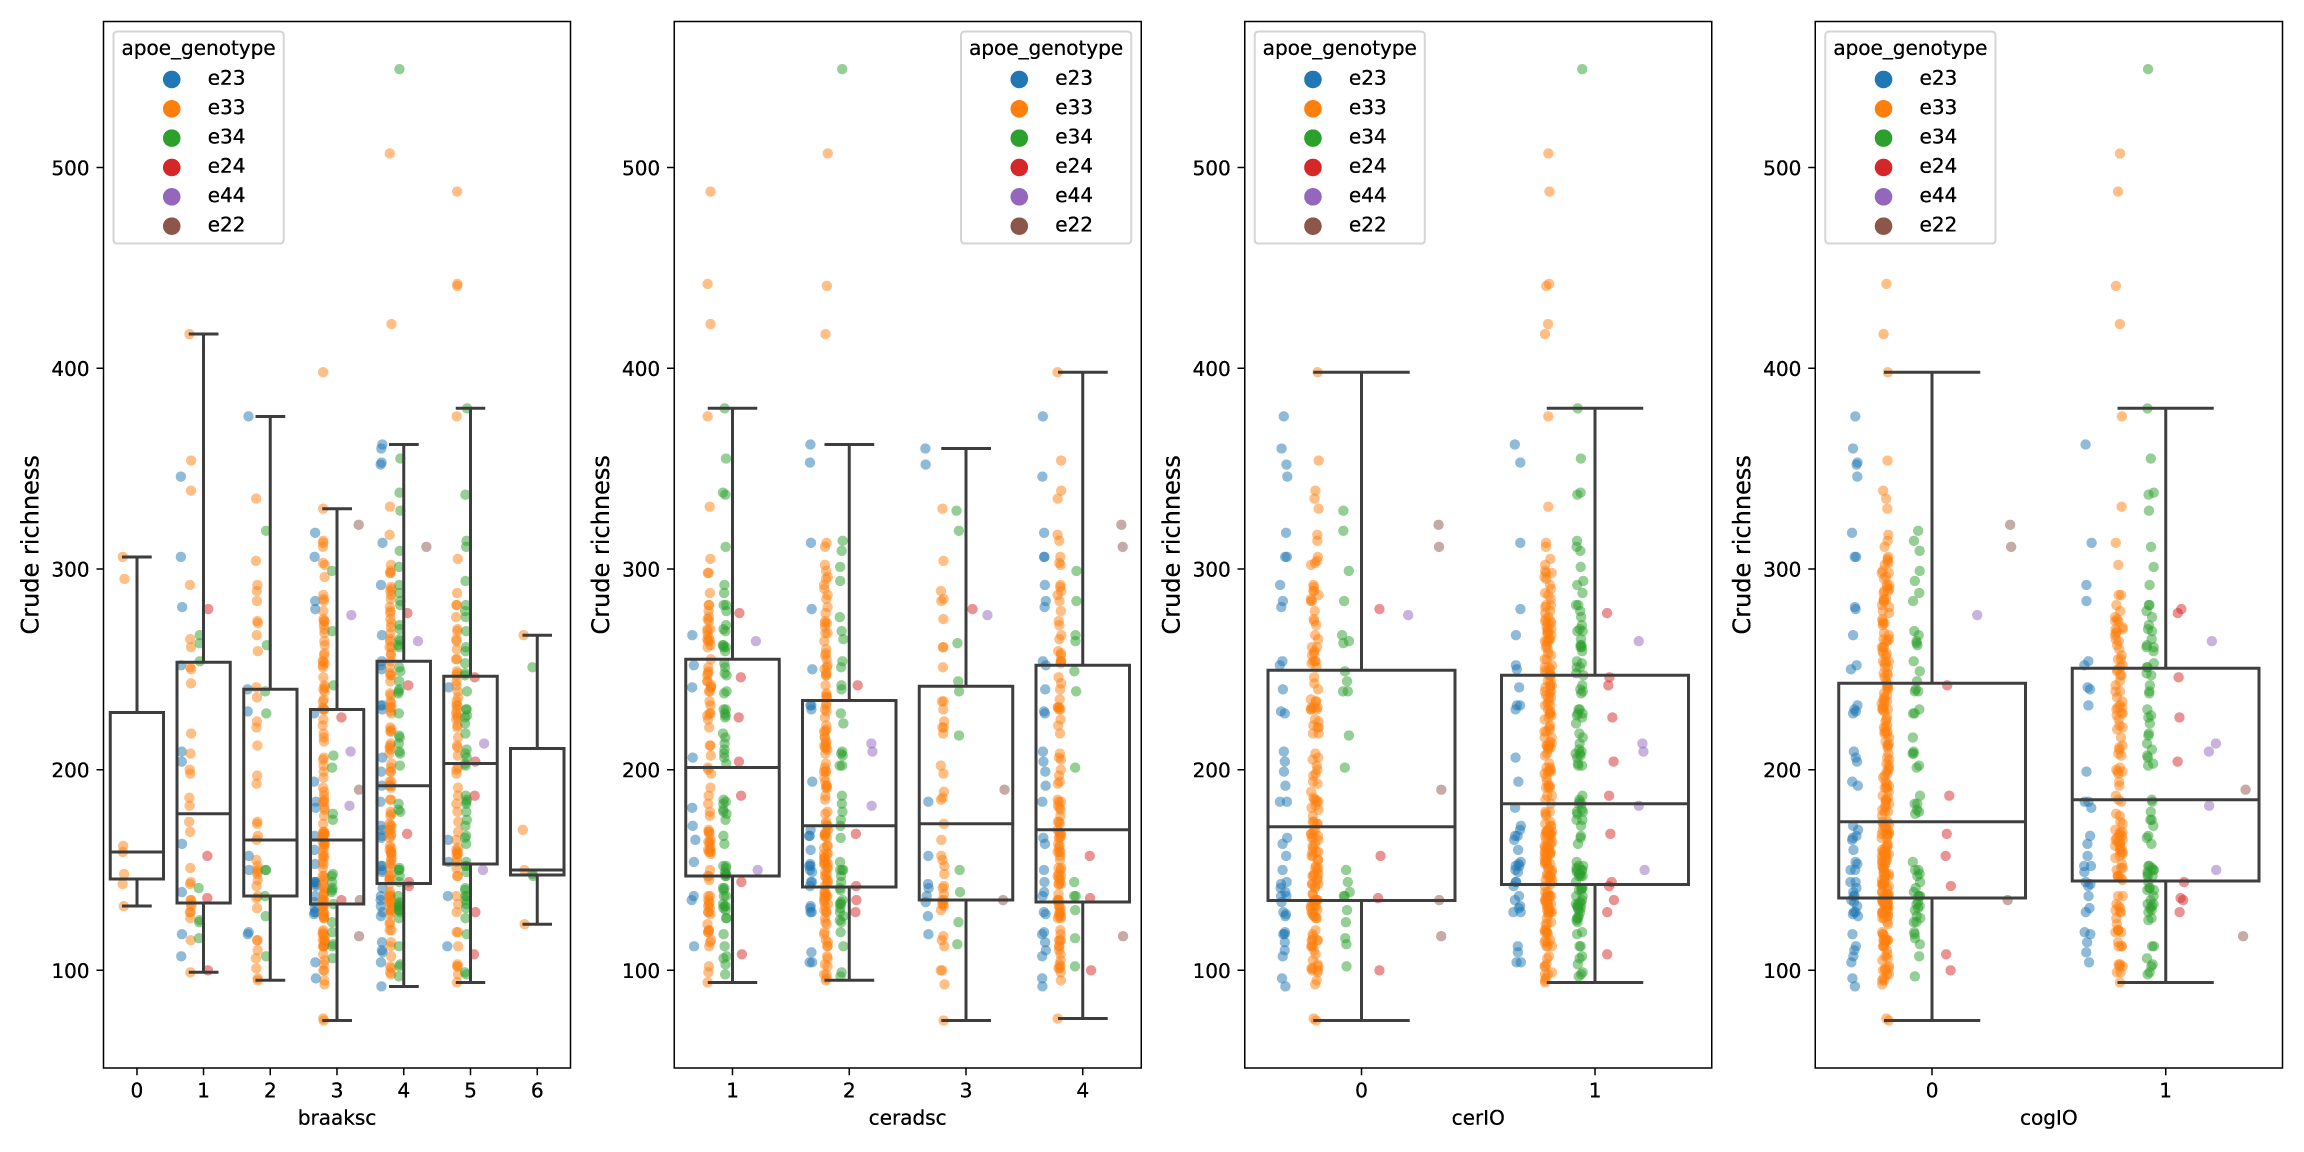
…just a little bit
Getting kraken2 to be set up for both Braken and qiime2 takes a little bit of work. First, you need to have the standard report for Braken, and you need the --mpa-report to use parse_kraken_to_biom.py from this helpful analysis. In order to get that going, its best to start small and test your first 10 samples. My samples are not ordered, so the first 10 included a mix of all experimental groups. Check that, otherwise you may threshold incorrectly.
#!/usr/bin/env bash
exec 1>> command.log 2>&1
set -ex

####KRAKEN
kdb='/path/to/db/minikraken2_v2_8GB_201904_UPDATE'
mkdir -p kraken
mkdir -p kraken_test

# test run (species richness vs confidence)
parallel -j10 --plus --rpl '{qq} s:.*/::; s:_R1.fastq.gz::;' kraken2 \
  --threads 10 \
  --db $kdb \
  --paired \
  --confidence {2} \
  --report kraken_test/{1qq}_{2}.mpa_report\
  --use-mpa-style \
  --output kraken_test/{1qq}_{2}.kraken \
  {1} {1/_R1.f/_R2.f} \
  ::: $(awk 'FS="," {print $2}' 20200905_manifest.csv | head -n11) \
  ::: 0 0.05 0.1 0.15 0.2 0.25 0.3 0.4 0.5 0.6 0.7 0.8 0.9

# calculate richness graph for confidence threshold
wc -l kraken_test/*.mpa_report > richness_test.txt
python kraken_test.py
Note the range of confidence thresholds
You are looking for the elbow of the curve, but go too far right and you end up removing all your OTUs. Here is a much better thread on it. Well, lets see what I have:
#!/usr/bin/env python

import numpy as np
import seaborn as sns
import pandas as pd

# import data, split filenames into samples & confidence
a = pd.read_table('richness_test.txt', header=None, sep='\s+')
a[1] = a[1].str.replace("kraken_test/", "")
a[1] = a[1].str.replace(".mpa_report", "")
a[['sample', 'confidence']] = a[1].str.rsplit("_", 1, expand=True)
a.rename(columns={0:'richness'}, inplace=True)

# make plot
b = sns.lineplot(x='confidence', y='richness', data=a, hue='sample')
b.set_ylabel("Crude richness", size=14)
b.set_xlabel("Confidence threshold", size=12)
b.figure.savefig('richness_test.pdf')
Will give you a plot of
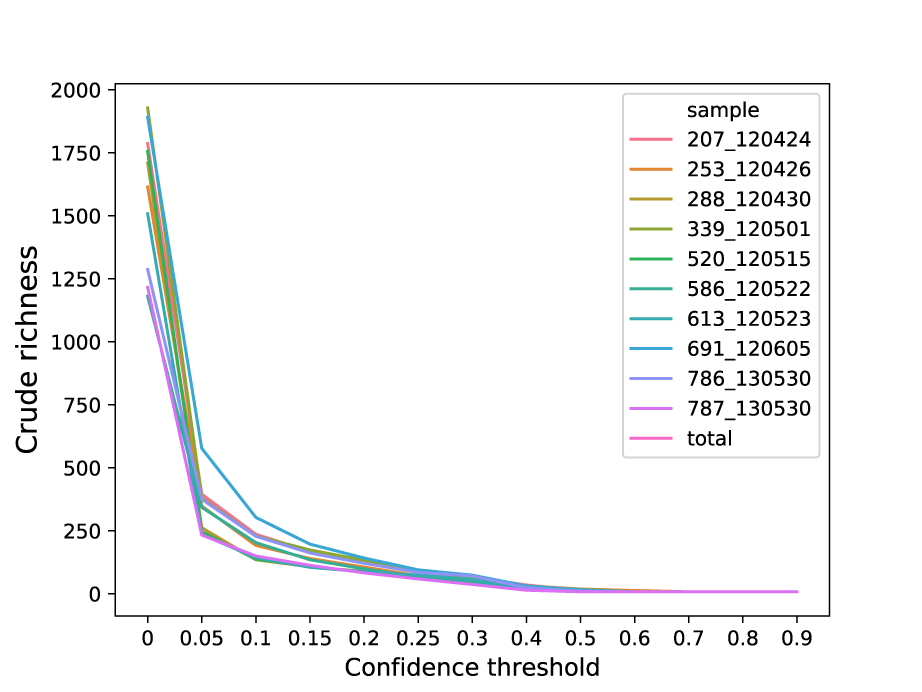
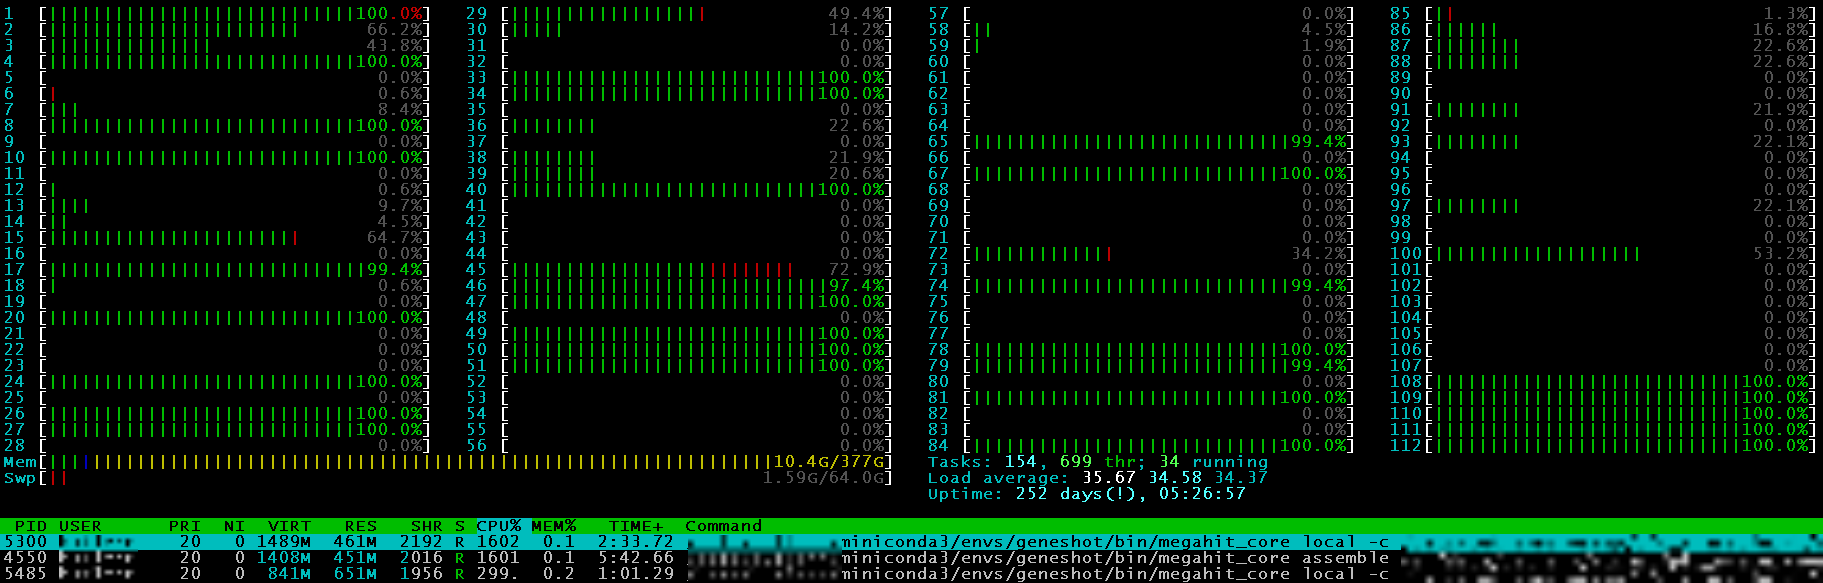
So, looks like 0.1 would be a good threshold to avoid noise. If you have too sparse data later on, you could dial it back closer to 0.05. So, lets break the server!
# with only 256GB of RAM, limit to 24 simultaneous instances(x4 = 96 threads)
parallel -j24 --plus --rpl '{qq} s:.*/::; s:_R1.fastq.gz::' kraken2 \
  --threads 4 \
  --db $kdb \
  --paired \
  --confidence 0.1 \
  --report kraken/{qq}.mpa_report \
  --use-mpa-style \
  --output kraken/{qq}.kraken \
  {} {/_R1.f/_R2.f} \
  ::: $(awk 'FS="," {print $2}' 20200905_manifest.csv)

# make standard report for braken
parallel -j24 --plus --rpl '{qq} s:.*/::; s:_R1.fastq.gz::' kraken2 \
  --threads 4 \
  --db $kdb \
  --paired \
  --confidence 0.1 \
  --report kraken/{qq}.report \
  --output kraken/{qq}.kraken \
  {} {/_R1.f/_R2.f} \
  ::: $(awk 'FS="," {print $2}' 20200905_manifest.csv)

# calculate richness graph for rough estimate
wc -l kraken/*.mpa_report > richness.txt
python kraken_richness.py
Lets do a quick check
#!/usr/bin/env python

import numpy as np
import seaborn as sns
import pandas as pd
import matplotlib.pyplot as plt

# import raw richness data
a = pd.read_table('richness.txt', header=None, sep='\s+')
a[1] = a[1].str.replace("kraken/", "")
a[1] = a[1].str.replace(".mpa_report", "")
a.rename(columns={0:'richness', 1:'specimen'}, inplace=True)

# merge with manifest
b = pd.read_csv('20200905_manifest.csv')
b = b.merge(a)

# plot raw richness (with four variables)
fig, axs = plt.subplots(nrows=1, ncols=4, figsize=(16,8))
blist = ['braaksc', 'ceradsc', 'cerIO', 'cogIO']

for i in range(4):
    sns.stripplot(x=blist[i], y='richness', data=b, hue='apoe_genotype',
        dodge=True, alpha=0.5, zorder=0.5, ax=axs[i])
    sns.boxplot(x=blist[i], y='richness', data=b, boxprops={'facecolor':'None'},
        showfliers=False, ax=axs[i]).set_ylabel('Crude richness', size=12)

# fig.show()
fig.tight_layout()
fig.savefig('richness_raw.pdf')
Next time
That worked out pretty well, the plot at the top is the crude result. I have much more analysis to do, but something has caught my eye. Next up lets get that data in biom format with parse_kraken_to_biom.py